
Fundamentally Fasteners: The one for solving codes of loads
A simplified methodology to evaluate failure of bolts


We at Ather Energy take pride in building durable and safe automobiles. The Ather Rizta has more than 1500 parts, but have you wondered what holds the majority of these parts together? The answer is Fasteners. We have hundreds of fasteners in Rizta that do this job very efficiently. The durability of any machine or automobile depends largely on these fasteners.
Some more context
Humans as a race have long ago understood the importance of fasteners to join different parts. The history of threads, which is fundamental to most fasteners, arguably traces back to 400 BC. Fasteners are everywhere around us whether it’s buildings, bridges, automobiles, machines or even mobile phones. All these modern structures and machines will fall apart without fasteners. There are numerous examples of how a failure of fasteners led to catastrophic failure of the structures and machines and, in many cases, endangered lives. This emphasizes the importance of the right selection of fasteners for any structure, to understand the loads acting on it and to evaluate failures.
That’s easier said than done. There are standards and thumb rules to select the fasteners, but it might not work for complex structures like automobiles which continuously experience dynamic loads. We may end up either overdesigning, which increases the cost of the product, or under designing these fasteners, which would lead to failures. We need to know the correct loads that these fasteners would experience in operating conditions which can then be used to determine the right fasteners and to evaluate the possible failures during development. In the second blog of the series “Fundamentally Fasteners”, we will delve deeper into evaluating failures in bolts, which is the most commonly used fastener.
In the previous blog, we talked about the failure modes of the bolts, available standards to determine these failures, and challenges in using these standards. The major challenge is determining the accurate forces and moments acting on the bolts in any complex system, especially in two-wheelers. Then we discussed how FE simulation can be leveraged to determine the forces and moments acting on the bolts. We discussed in length how the correlation of the simulation model with respect to test data was done for a complex system experiencing vibration loads. The correlation of the simulation model with the test/physical behaviour is the most important aspect here because if the simulation model is correlated, then we can rely on the force and moment outputs. These trusted force and moment outputs can then be used to determine the different types of bolt failures.
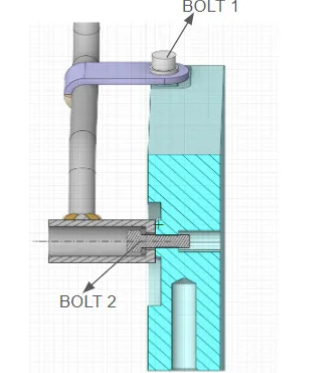
We will briefly touch upon the case study discussed in the previous blog. We have a tubular structure with an overhang mounted on the rigid structure using two bolts.
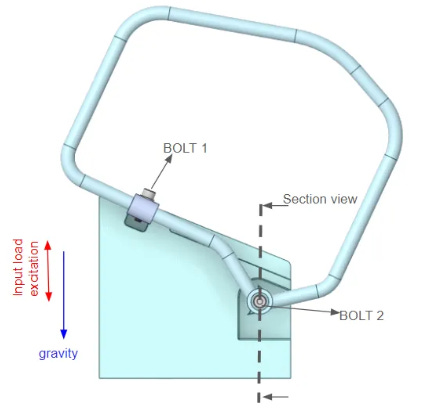
A transient analysis was performed to mimic the road loads acting on the structure. Then the simulation model was correlated to match the frequency and the acceleration amplitude as observed in the physical test.
The image below compares the transient acceleration response from the simulation with the acceleration recorded from the physical test at the peak acceleration location, i.e., at the topmost point of the tubular structure.
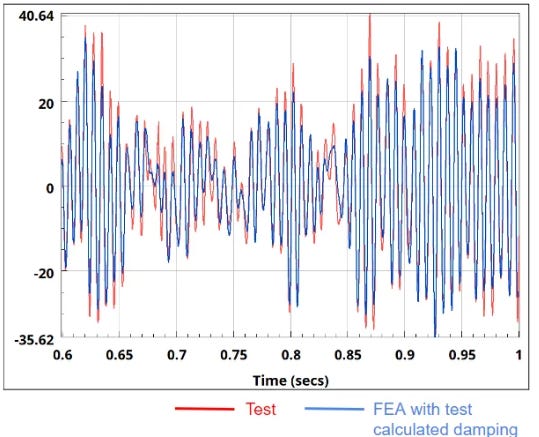
Since a very good correlation was achieved, we can rely on the forces and moments acting on the bolts generated through FEA for the bolt failure evaluation.
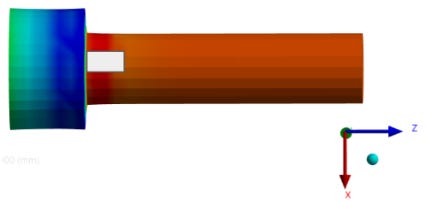
For further discussion, we’ll refer to the coordinate system shown in the image below for the direction of forces and moments acting on the bolts.
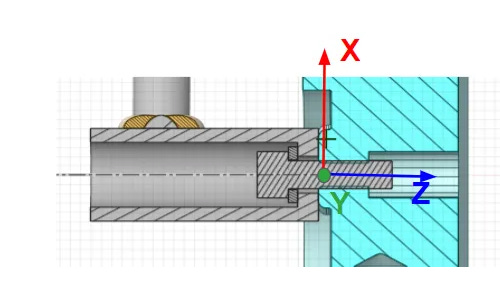
Axial forces on bolts are along the Z-axis while shear forces (transverse) will be in the XY plane of the coordinate system i.e. resultant of X & Y direction forces. Similarly, moment about the Z-axis will result in torsion deformation of the bolt, and moments about the X and Y axes will cause a bending deformation of the bolt.
As we are clear on the coordinate system, let’s talk about the output from this simulation: the forces and moments acting on the bolts. Since transient load is applied as input, of course, force and moment outputs acting on the bolts are also transient. A snippet of transient forces acting on one of the bolts along the X direction is shown below:

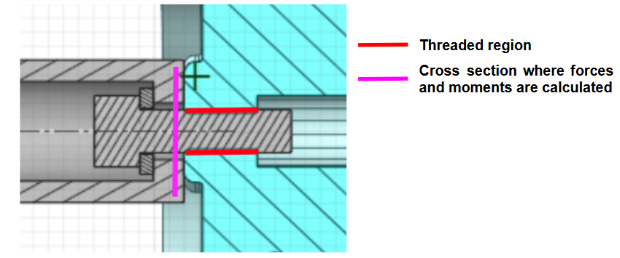
These transient forces and moments are calculated at the cross-section of the bolt slightly away from the threaded region, as shown in the following image.
Deep-dive into bolt failures
Here are the different types of bolt failures:
1. Bolt yielding: Bolt yielding failure occurs when the working stress acting on the bolt exceeds the yield strength of the bolt.
2. Bolt fatigue: A bolt’s fatigue failure happens when the alternating stress acting on it exceeds its endurance limit.
3. Bolt slipping: Bolt slipping occurs when the transverse loads acting on the bolted joint exceed the clamp load applied to the joint. This subsequently leads to bolt loosening.
4. Bolt shearing: Bolt shearing occurs when the external load overcomes the static friction at the bolt interface. This is a subsequent failure occurring after bolt loosening.
5. Thread stripping: Failure at the threaded section of the bolt due to the tensile and torsional stress caused by axial load and torque acting on the threads.
6. Crushing of clamped plates: Crushing of clamped parts happens when the interface/surface pressure due to the service loads exceeds the permissible pressure of the clamped material.
Before proceeding to the calculation part for different types of bolt failures, the loads and the stresses acting on the bolts are discussed.
Loads acting on the bolt:

Stress calculation due to the loads acting on the section of the bolt:

Here, d₃ is the pitch diameter of the bolt.
We get these force and moment outputs from transient simulation from our correlated simulation model which can be used to evaluate different types of bolt failures discussed in the following sections.
Bolt Fatigue Failure
Most people intuitively understand the concept of fatigue failures, even without engineering backgrounds. As the name suggests, any part can fail when repeated loads are applied over a period of time. These loads would be insufficient to cause the failure of the part in a single cycle. If we bend a wire once, it will not fail, but, if we apply the same bending load back and forth over a specific time, it will break due to fatigue failure. Though it is easy to understand what fatigue failure means, it is challenging to predict fatigue failures, especially for the bolts. Fatigue failure is the most common failure mode for the bolts.
Fatigue failure of a bolt happens when the alternating stresses acting on the bolt exceeds its fatigue strength. Alternating stresses acting in the bending tension fibre caused by axial load and bending moment will lead to fatigue failure of the bolt.
Alternating stress, σₐ = Tensile stress + Equivalent bending stress
An important question comes up. Can tensile stress and bending stress be added directly? The answer is yes, and the rationale behind it is explained here. Here, a bolt is taken, and pure axial load is applied along the bolt axis at the thread end of the bolt by fixing the bolt head end, which will induce pure tensile stress. In the second case, a bending load is applied at the thread end of the bolt by fixing the bolt head end, which induces pure bending stress, as shown in the following GIFs:
Now, let’s take the most stressed region for both cases, shown in the white rectangular region in the below images.
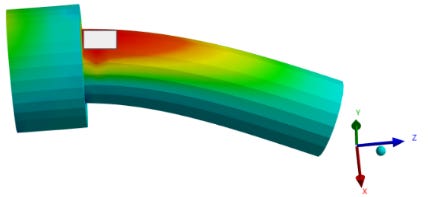
Let’s focus on the stresses acting on the white-marked rectangular region for both cases. For the first case, axial loading will cause the bolt to stretch along the z-axis. In the second case, bending will cause stretching of the bolt along the z-axis in the rectangular marked region. In both cases, stretching in the rectangular marked region is happening along the z-axis, and that is the reason we can add up the stresses for that region or in terms of FEA at that particular node/element.
Now, it is established that the tensile stresses and bending stresses can be added to calculate the alternating stresses acting on the bolts.

where,


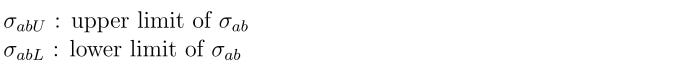
We need upper and lower limits from transient stress history to calculate this alternating stress.

where,
So, force along the bolt axis F𝓏 and moments Mₓ and Mᵧ perpendicular to the bolt axis are required to calculate the alternating stress acting on the bolt. If these force and moment values are known, we can calculate the stresses and further fatigue failure evaluation can be done. These forces depend on the service loads acting on the bolted joints which is difficult to determine from the physical testing in case of complex joints.
In the above case study, we discussed how we can leverage simulation techniques to get transient force and moment output when road/vibration loads act on any bolted joint. These varying loads cause the fatigue failure of the bolts. Since the simulation model is correlated with the test data, the force and moment outputs from the simulation can be trusted for the fatigue calculations.
In cases where constant amplitude cyclic loading occurs throughout the life of the bolt, the alternating stress can be calculated for these cyclic loads and it can be compared against the fatigue strength of the bolt to determine the safety factor for the given bolt.
However, in cases where a varying-amplitude cyclic load acts on the bolted joint, the safety factor cannot be directly calculated, as alternating stress will vary for each unique min-max force value, as shown in the figure below:
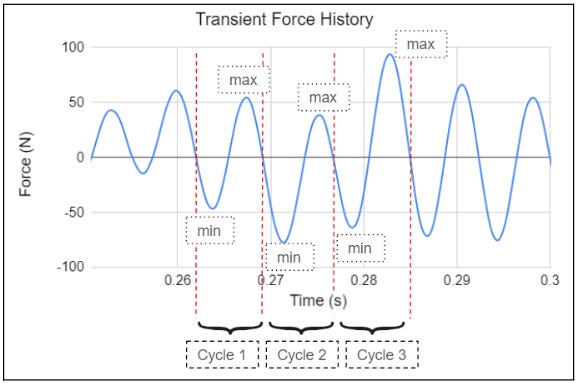
In this case, the question will be what min-max force value is used to calculate the alternating stress value. Rainflow counting techniques can be used to determine the counts of these unique cycles that the bolts will experience, which will be further used for damage calculations.
Before going into the details of these failure calculations, let’s discuss the rainflow counting technique used in fatigue failure evaluation. The rainflow counting technique is a simple yet powerful method to post-process the transient data. Using this method, the transient data can be segregated into different bins of unique min-max or mean-range values and count the number of such items in each bins. This technique is used to determine the cycle count for each unique repeats of the constant force amplitude reversals.
For the transient force output in Figure 4, rainflow counting was done, and the histogram for that is shown in the image below:
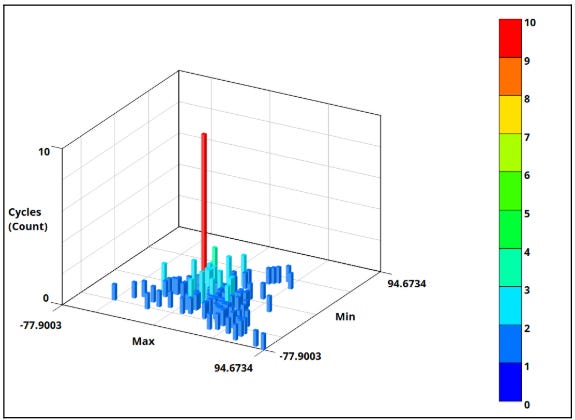
In this 3D graph, we have minimum and maximum force amplitudes in the X and Y axis and the number of cycles for all these unique min to max reversals in the Z axis.
Once the minimum and maximum force values for all unique reversals are known and the number of repeats for these reversals is calculated, this data can be used to calculate the bolts’ fatigue life.
For each of these unique min to max force values corresponding to the alternating stress values can be calculated using the equations mentioned above. Once the stresses are calculated, the damage can be calculated for each unique alternating stress value using the S-N curve for the bolt material. Any standard fatigue solver can be used to calculate the damage from these stress values. Then, the damages for all these cycles can be summed up using Miner’s rule, total damage should be less than 1. Two identical specimens at the macroscopic level, when tested for fatigue, may show a life to failure in a band of multiplier of 2. Hence it is advisable to not exhaust the total damage of 1 in the design but rather limit it to a maximum of 0.5 being reasonably conservative.
Bolt Yielding
Bolt yielding, as name suggests, occurs when the tensile stresses acting on the bolt due to the high service loads exceeds the yield strength of the bolt. Bolt yielding can happen due to high stresses in tension, bending or torsion. To determine if bolt yielding can happen, working stresses can be calculated on the bolt due to the peak loads and that has to be compared against the yield strength of the bolt.
To prevent the yielding of the bolt due to the service loads, working stresses acting on the bolt should be lower than the yield limit of the bolt.
Working stress,

Where,

and

So, to calculate the safety factor for bolt yielding failure we need:

We can leverage the simulation to determine these force and moment values. For the above-mentioned simulation we have transient force and moment histories but to determine the yielding of the bolt, maximum force and moment values are required.
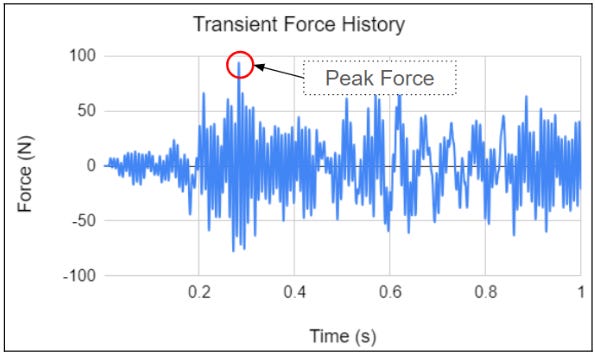
We need to take the peak force value F𝓏 from the transient force history output as shown in the above image. Similarly peak M𝓏 value can be taken from the simulation. These force and moment can be taken as input to calculate the yield stresses acting on the bolt and eventually safety factor for bolt yielding by comparing it against the yield strength of the bolt.
We have discussed two common failure modes of the bolt, bolt fatigue and bolt yielding. Now we will discuss the fatigue failure evaluation of the bolt for the dummy component discussed in the beginning of this article.
Evaluation of bolt fatigue failure for the dummy component
In this section, we will discuss the fatigue failure evaluation of bolts for the dummy component shown in Figure 1. For this dummy component, there are two bolts, an upper bolt named bolt 1 and a lower bolt named bolt 2. We calculated the damage for these bolts using the methodology discussed above and the results are compared with the test observations. Multiple samples of dummy components were tested on the physical vibration shaker rig, and in all these samples the bottom bolt i.e. bolt 2 failed.
To calculate the damage, the stresses acting on the bolts due to these vibration loads are required. Since it is a fatigue failure due to random/vibration loads, we will have a transient stress history instead of a single stress value. To calculate the stress histories, we need transient forces and moments acting on these bolts due to the varying loads. It is difficult to get these transient force and moment histories from the testing. Simulation capabilities are leveraged to get these transient force & moment histories.
As discussed in the above sections, the simulation model is first correlated with the test data. Modal behaviour, harmonic behaviour and transient responses are correlated. Since the simulation model is correlated with the test data, forces and moments extracted on the bolt cross sections from simulations can be trusted. Using these force and moment histories, transient stress histories can be calculated using the equations discussed above. Using these stresses, the damage acting on these two bolts can be calculated. Any fatigue solver can be used to calculate the damage using the transient stress histories.
It is to be noted that the simulation was done for 1 second of transient data but it can be extrapolated for the exact number of hours for which the dummy component was tested on the vibration shaker rig since varying load is repeatable. Also, damage can be summed for the exact number of hours since damage is a linear quantity as per Miner’s rule.
We calculated the damage for 1 sec of transient stress data from the simulation but the test was done for 50 hours on the physical vibration shaker. Here, 50 hours of test done on vibration shaker rig for the dummy part is equivalent to damage accumulated on the part for 1 lakh km on the road. Using Miner’s rule the damage is computed for 50 hours by simply summing up the damage for 1,80,000 seconds using the damage value for 1 sec. For the bottom bolt, for 1 second of data, the damage value is 1.48e-5. By multiplying it with 1,80,000 seconds the damage value comes out to be 2.66 for 50 hours. Similarly for the top bolt, for 1 second data, the damage value is 1.16e-6 and by multiplying it with 1,80,000 seconds the damage value comes out to be 0.21 for 50 hours.
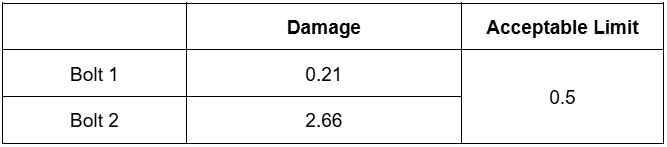
We see that the damage value for bolt 2 is higher than the acceptable limit of 0.5, and for bolt 1 it is well within the acceptable limit. From the testing also, we have the same observations, the bottom bolt failed for the multiple samples. This established the correlation between our calculation and the test observations.
It is also to be noted that we have not accounted for mean stresses i.e. the stresses on the bolts due to the torquing of the bolt itself, which will be the same for both the bolts. The damage on the bolts is computed due to the alternating stresses only due to the external loading.
Conclusion
We discussed different types of bolt failures and the challenges involved in evaluating these failures. We discussed how simulation techniques can be leveraged to calculate the forces and moments acting on the bolts and hence stresses acting on bolts. Then it was discussed how the simulation model was correlated with the test data. Since the simulation model is correlated, we can trust the forces and moments and hence the stresses acting on the bolts.
We discussed the simplified techniques for calculating the stresses acting on the bolts once the forces are known. We computed the damage using these stress histories on a dummy component and compared the failure mode with the test observations. Our evaluation shows failure at the exact same bolt where it failed on the multiple physical samples. This correlation with the test data established the methodology discussed here for the bolt failure evaluation.
In nutshell, we discussed a simplified methodology to evaluate the failure of bolts. In this blog, we analysed the bolt failure for random vibration loads. This methodology can be extended to any type of loads be it static load, random road loads or any other complex loading condition.
In the next blog, we will extend this methodology to the full vehicle which is much more complex to determine the forces on the bolts and predict the failures.
 | A guest post by
|